

Posts tagged Value Pickr
Tracxn Technologies (27-05-2024)
PE and VC firms who use private company data are rich folks who have shitloads of money and are short on time. They are entirely price inelastic.
This is not a business you can compete on price.
I believe there are no pe VC investors who only use traction and do not use other more premium platforms. Hence I think traction is mostly subscribed as a second option by these rich folks to find any additional information which their most preferred platform might not have.
Avanti Feeds (27-05-2024)
I don’t think its a very scalable business as Avanti already has a large market share. The problem is Avanti is a big fish in a small pond. It will be wrong to expect high growth rates from here. Yet, on the positive side – govt keeps talking about growing exports from India…and over last 5 years nothing much has happened in the industry…hence at some point there should be some growth.
The Surojit Saha Portfolio! (27-05-2024)
Hello ValuePickrs,
I hope this post finds you well. I wanted to share an update on my portfolio as part of my journey to maintain accountability and, hopefully, provide some insights that might be useful to fellow investors.
Investment Approach:
- Fundamental Analysis: I primarily focus on fundamental analysis to guide my investment decisions. I believe in the long-term value of strong, well-managed companies.
- Technical Analysis: I utilize simple technical indicators to help time my entry and exit points, aiming to maximize returns while managing risks.
Goals: My goal is to achieve financial freedom within the next 7-10 years. I believe that by sharing our experiences and learning together, we can all become better investors.
Disclaimer: I am not a professional investor. These are my personal views and experiences. I encourage everyone to conduct their own research and due diligence.
Looking forward to learning and growing with this wonderful community.
Happy investing!
SJS Enterprises Ltd (27-05-2024)
Thats a valid point. As far as i understood, at expense of over simplifying, glass cover here is same as say gorilla glass used for mobiles, just that given its used for in vehicle display it has to be more durable, anti glare etc.
Quick google search throws few companies already doing it : agc, micro tc, corning etc. May be none from India yet.
Would be interesting to know the moat here.
SJS Enterprises Ltd (26-05-2024)
Could someone help me to understand the below. I was intending to raise this question with management during concall but I didn’t log into call due to some personal work
SJS claims that cover glass opportunity is a game changer for them and opportunity size is huge moreover no other company available to manufacture such product. I wanted to understand what is SJS Moat here ? If the opportunity is huge, definitely more companies will jump into this space to capture the market. And it doesn’t require huge investemnt as well.
So what is SJS moat here ? Is the technology complicated and no one can replicate it or they have got any copy rights on the technology ?
Dis : Invested at lower levels.
Multi-Disciplinary Reading – Book Reviews (26-05-2024)
Theme :
Author of the book contend that Physics and Mathematics are not enough and we have a lot to learn from Biology, Evolutionary Biology to explain our financial systems.
FINANCIAL FEAR FACTOR
Due to millions of years of evolution , our fear reflexes are highly refined and faster to save us from danger much faster , even than our conscious mind.
But it turns out that the same neural circuits are often triggered when we’re threatened in other ways—emotionally, socially, and financially— and therein lies the problem.
While the fight or flight response might have some benefits, it almost surely won’t help you when the stock market crashes
The Adaptive Markets Hypothesis is based on the insight that investors and financial markets behave more like biology than physics, comprising a population of living organisms competing to survive, not a collection of inanimate objects subject to immutable laws of motion.
It implies that the principles of evolution—competition, innovation, reproduction, and adaptation—are more useful for understanding the inner workings of the financial industry than the physics-like principles of rational economic analysis.
Learning is a form of conceptual evolution.
We begin learning a new behavior using a heuristic—our rule of thumb—that may be very far from optimal. If we receive negative feedback from applying that heuristic, we change the heuristic. We don’t even have to do this consciously. We reproduce the original behavior, but make a variation on it. If this change yields positive feedback, we keep using the new heuristic; if the feedback is still negative, we change it again. Over time, and after a sufficient number of tries, even the clumsiest process of trial and error can lead to an efficient heuristic
However, there’s a very important difference between biological evolution and human learning: our heuristics can evolve at the speed of thought. This is key to the success of Homo sapiens as a species.
THE ADAPTIVE MARKETS HYPOTHESIS
Although the Efficient Markets Hypothesis has been the dominant theory of financial markets for decades, it’s clear that individuals aren’t always rational. We shouldn’t be surprised, then, that markets aren’t always efficient.
We aren’t rational actors with a few quirks in our behavior—instead, our brains are collections of quirks.
We’re not a system with bugs; we’re a system of bugs.
Basic gist of Adaptive Markets Hypothesis
1. We are neither always rational nor irrational, but we are biological entities whose features and behaviors are shaped by the forces of evolution.
2. We display behavioral biases and make apparently suboptimal decisions, but we can learn from past experience and revise our heuristics in re- sponse to negative feedback.
3. We have the capacity for abstract thinking, specifically forward- looking what-if analysis; predictions about the future based on past experience; and preparation for changes in our environment. This is evolution at the speed of thought, which is different from but related to biological evolution.
4. Financial market dynamics are driven by our interactions as we behave, learn, and adapt to each other, and to the social, cultural, political, eco-nomic, and natural environments in which we live.
5. Survival is the ultimate force driving competition, innovation, and adaptation.
If markets are truly efficient, then no amount of analysis is going to help an investor to beat the market—so why not invest in an index fund instead?
If no amount of analysis is going to help an investor beat the market, what are we to make of George Soros breaking the Bank of England, or John Paulson’s $20 billion profit from 2007 to 2008 betting against the housing bubble, or the extraordinary careers of the computer scientist David Shaw and the mathematician James Simons, whose hedge funds have consistently managed to beat the market?
THE ISLANDS OF EVOLUTION
It turns out hedge funds are a direct analogy to the Galapagos Islands in the financial world.
Different forms of funds innovate and proliferate just like the finches on Darwin’s far-flung islands.
Some hedge fund strategies gain while other strategies lose, and in the background, there’s a constant process of hedge fund formation, innovation, and extinction. The Adaptive Markets Hypothesis explains this diversity: why some hedge funds succeed, why most hedge funds fail, and why the largest and most successful hedge funds employ a great diversity of strategies.
The Adaptive Markets Hypothesis provides a compelling answer: hedge funds are an important indicator species in the financial ecosystem.
During good times, hedge funds are the “tip of the spear”; they’ll take advantage of new investment opportunities as soon as they arise. During bad times, hedge funds are the “canary in the coal mine”; they’re the first to suffer from any kind of financial dislocation.
AN EVOLUTIONARY HISTORY OF THE HEDGE FUND
Despite the relative simplicity of the hedge fund as a form of investment—at its core, it’s simply a private partnership.
The rise of these funds in the modern financial environment is exactly parallel to the evolution of a successful species in a changing biological environment.
Unlike biological evolution, however, financial evolution proceeds at the speed of thought, where several generations of ideas can come and go within the time span of a productive working lunch.
THE TRADITIONAL INVESTMENT PARADIGM
If you’ve ever received any professional investment advice, you were probably introduced to these principles:
Principle 1: The Risk/Reward Trade-Off. There’s a positive association between risk and reward among all financial investments. Assets with higher reward also have higher risk.
Principle 2: Alpha, Beta, and the CAPM. The expected return of an investment is linearly related to its risk (in other words, plotting risk versus expected return on a graph should show a straight line), and is governed by an economic model known as the Capital Asset Pricing Model, or CAPM (more on this later).
Principle 3: Portfolio Optimization and Passive Investing. Using statisti- cal estimates derived from Principle 2 and the CAPM, portfolio manag- ers can construct diversified long-only portfolios of financial assets that offer investors attractive risk-adjusted rates of return at low cost.
Principle 4: Asset Allocation. Choosing how much to invest in broad asset classes is more important than picking individual securities, so the asset allocation decision is sufficient for managing the risk of an investor’s savings.
Principle 5: Stocks for the Long Run. Investors should hold mostly equities for the long run.
Financial economist William F. Sharpe observed that the fluctuations of an investment’s return can be separated into two distinct components: fluctuations due solely to the unique characteristics of the asset, and fluctuations due to economy wide factors like economic growth, unemployment, inflation, political instability, and so on.
He called the former kind of risk “idiosyncratic” and the latter kind “systematic”
Sharpe developed an explicit measure for systematic risk called beta and concluded that an asset’s expected return is directly proportional to its beta.
An asset with a beta of 1 would have systematic risk comparable to that of the broadest portfolio of all risky assets, which he called the “market portfolio.” For convenience, we approximate the market portfolio by broad stock market indexes like the S&P 500.
On the other hand, an asset with a beta of 0 has no systematic risk—which doesn’t mean it has no risk, because there’s still idiosyncratic risk—and should therefore pay no extra return or risk premium to investors. In the same way, an asset with a beta of 2 has twice the systematic risk of the market portfolio.
THE GREAT MODULATION
The Adaptive Markets Hypothesis, however, tells us that long periods of market efficiency and stability are not guaranteed; they depend on the stability of the overall environment.
When there are big changes that have significant impact on that environment—including political, economic, social, or cultural shifts—markets are going to reflect those changes.
The number of inhabitants on this planet has more than quadrupled in a hundred years. Such vast and rapid growth has financial as well as ecological implications. The activities involved in acquiring assets, income, education, or permanent housing for the 7-billion plus necessarily increase the required scale of financial markets, as well as the complexity of the interactions among the various counterparties.
RISK/REWARD AND PUNISHMENT
The Adaptive Markets Hypothesis tells us that risk isn’t necessarily always rewarded—it depends on the environment. Investing in stocks for the long run may or may not be good advice, depending on where you’re investing, for how long, and what your risk tolerance is.
THE DEMOCRATIZATION OF INVESTING
A new investment paradigm is emerging.
Let’s reconsider the five principles of the traditional investment paradigm from the perspective of Adaptive Markets:
Principle 1A: The Risk/Reward Trade-Off. During normal market condi- tions, there’s a positive association between risk and reward among all financial investments. However, when the population of investors is dominated by individuals facing extreme financial threats, they can act in concert and irrationally, in which case risk will be punished. These periods can last for months or, in extreme cases, for decades.
Principle 2A: Alpha, Beta, and the CAPM. The CAPM and related linear factor models are useful inputs for portfolio management, but they rely on several key economic and statistical assumptions that may be poor approximations in certain market environments. Knowing the environ- ment and population dynamics of market participants may be more im- portant than any single factor model.
Principle 3A: Portfolio Optimization and Passive Investing. Portfolio opti- mization tools are only useful if the assumptions of stationarity and rationality are good approximations to reality. The notion of passive investing is changing due to technological advances, and risk manage- ment should be a higher priority, even for passive index funds.
Principle 4A: Asset Allocation. The boundaries between asset classes are becoming blurred, as macro factors and new financial institutions cre- ate links and contagion across previously unrelated assets. Managing risk through asset allocation is no longer as effective today as it was dur- ing the Great Modulation.
Principle 5A: Stocks for the Long Run. Equities do offer attractive returns over the very long run, but few investors can afford to wait it out. Over more realistic investment horizons, the chances of loss are significantly greater, so investors need to be more proactive about managing their risk.
ADAPTIVE MARKETS AND LIQUIDITY SPIRALS
Liquidity is the measure of how easy it is to buy or sell an asset. Shares of Apple are very liquid—you can easily buy or sell them at the click of a mouse button. Your house isn’t nearly so liquid; it takes weeks and months to buy or sell a house
How does liquidity arise?
Imagine that many more people want to buy shares of Company than those who want to sell them—what happens?
Basic economics tells us that the price of that security should rise until demand eventually equals supply and the market reaches an equilibrium.
But how does that occur in practice?
After all, who wants to sell a stock, knowing that the increased demand is going to cause it to increase in value? Traditionally, designated market makers, such as the NYSE/ AMEX specialists and NASDAQ dealers, have played this role, providing supply when there’s excess demand, and providing demand when there’s excess supply.
In other words, traditional market makers sell when you want to buy and they buy when you want to sell. They get rewarded for doing so.
Exchanges allow market makers to charge two different prices, one for buying from us (the “offer” price), and a higher one for selling to us (the “bid” price).
So market makers get to buy low and sell high on every trade, and we get to do just the opposite. We’re giving them an incentive to take the other side of our trade, that is, to provide us with liquidity.
That’s why they’re called “market makers”—they make markets in a very practical sense, and the bid/offer spread is their fee for doing so.
Finance Behaving Badly
Although the world is no stranger to financial crises, the size, breadth, and duration of the 2008 crisis tells us something’s changed.
The outsized population of Homo sapiens has brought with it some outsized challenges, including threats to financial stability.
The growing importance of finance means we have to start paying more attention to the three key features of the financial ecosystem highlighted by Adaptive Markets: the behaviors of the different species, the environment in which the behaviors take place, and how the two interact and evolve over time.
THE TYRANNY OF COMPLEXITY
The challenges posed by technology are part of a broader trend of in- creasing complexity. As the financial system grows more complex, it becomes harder and harder to understand, never mind manage. In fact, our attempts to regulate this complex system by layering rule on rule have actually increased complexity and uncertainty.
Government is a source of systemic risk
In the Adaptive Markets framework, complexity means we don’t have a good narrative for the system. The solution is obvious: we need to get smarter. Complexity can sometimes be reduced by developing a deeper understanding of the underlying structure of the system.
ECOSYSTEM MANAGEMENT
We may never be able to fully prevent financial crises. When free en- terprise is coupled with human nature, greed will dominate fear from time to time. But we can make the system more robust and resilient.
we have to look at the financial system as a system, and ask whether or not it’s sustainable, resilient to environmental shocks, and operating as efficiently as possible given existing resource and technological constraints.
Rather than simply imposing rules against bad behavior, a better approach is to develop a deeper understanding for how such behaviors arise and determine what aspects of the environment need to be changed to reduce or eliminate them.
In fact, biological systems offer many examples of highly effective regulatory mechanisms that are the product of millions of years of evolution.
For example, humans are endowed with “thermal homeostasis,” the ability to regulate body temperature to within a narrow range around 98.6 degrees. When body temperature falls because of exposure to cold, the hypothalamus detects the change and responds by caus- ing the body to shiver, generating heat; when the body becomes too warm, the hypothalamus causes it to perspire, which cools the body through evaporation. These processes evolved over millions of years to maintain a relatively constant body temperature, especially within the highly temperature-sensitive human brain.
At the core of many of these biological regulatory processes are feed- back loops, designed to prevent the system from getting too close to the point of no return.
Financial crises are a form of positive feedback, like the squeal of a microphone, where small changes are amplified into large effects.
LAW IS CODE
To regulate the financial system as a whole, we need to better under- stand the existing corpus of financial regulation as a whole.
Could the principles of good software design be used to improve the way we write financial regulations?
If different parts of these software systems are tightly coupled, then changes to one component could cause failures in other components, and the sheer size and complexity of these systems may make it virtually impossible to anticipate all the ways that failures could happen
To visualize the amount of coupling in a piece of software, let’s cre- ate a graph where each module is represented by a dot and anytime one module references another module, we’ll draw an arrow going from the module being referenced to the module that contains the reference. The result is a network map of all the interdependencies between differ- ent parts of the code, and coupling can be measured by how dense or sparse this map looks. A very dense graph means there are lots of inter- dependencies—a sign of a poorly designed system—and a sparse graph means most of the modules are stand-alone and the chances are smaller that changing one module will cause another to crash.
These network graphs, help to measure regulatory complexity, provide an X-ray of the hidden struc- tures within current banking regulation.
By using better technology to understand the complexity of these regulations, we can design a better system, one that adapts to the growing complexity of the financial world.
MAPPING FINANCIAL NETWORKS
Another useful feature of network graphs is the ability to model contagion. If we let the dots represent financial institutions, a network graph of counterparty relationships between these institutions could show how losses at one institution can be transmitted along unexpected financial linkages to other institutions
Like an epidemiologist studying the spread of a contagious disease from its point of origin, we should identify the potential linkages through which a financial crisis might travel.
Manappuram Finance (26-05-2024)
Please correct me if my understanding is incorrect.
In case original shareholders (Mr. Raja and others) were not having money to subscribe Right issue, rather than Mr. VP Nandkumar & Mr. Babu subscribing those available rights, Manappuram too was eligible to apply for these available additional rights. And if Manappuram would have subscribed these, promoters would have got indirect benefit.
But subscribing direct, they got preference over rest of shareholders of Manappuram like FIIs, DIIs, Retail shareholders.
Here quantum of direct holding by Promoters vs that of Manappuram must not be that material when it comes to doing right things in right spirit & intention.
Manappuram Finance (26-05-2024)
Interesting data points.
Looking at parameters like:
NPA level (less than 2%),
Price to Book (less than 1.5),
Price to Earning ( around 7),
Sales Growth rate (5Y around 15% CAGR),
Profit Growth Rate (5Y around 18% CAGR),
Solid Capital adequacy (around 30%)
PEG ratio less that 1
Return on Equity (around 20%)
It seems like an experienced techie from Tier-1 IIT but employed at a salary of ITI fresher.
But looking at it under-performance over last 5 years (when rest of stocks in Indian Stock Market has moved to sky) – it seems perception among the masses (those who matters like large fund houses, well known Indian Investors etc.) is not yet good for Manappuram in recent times.
And without good perception, how long it will be on similar valuations – remains a guess.
Note: Got this investment note from Mr. Rajeev Agrawal, dated 24/05/2021 i.e. exactly 3 years back, when MCAP of Manappuram in USD terms was $1.863 billion. At today’s rate of USD/INR … It seems those FII’s who invested 3 years back gained nothing other than dividends.
Look forward to a catalyst, which will rerate Manappuram.
Goldiam International : A rare shareholder friendly and debt free Jewelry company (26-05-2024)
Sharing some of the notes that i had compilied some time back.
What is Lab Grown Diamonds (LGD):
-
There are two distinct methods to create Lab Grown Diamonds.
- The high-pressure, high-temperature (HPHT) method: Gem-quality lab-grown diamonds are created in two primary ways. The high-pressure, high-temperature (HPHT) method simulates the conditions of a natural diamond’s growth. With this method, a diamond seed is placed into a chamber along with carbon and a metal catalyst. The assembly is then compressed with anvils and heated up, creating temperatures of 1300–1600°C and pressures of 5–6 GPa
- Chemical Vapor Disposition (CVD): This method enables scientists to grow synthetic diamonds using moderate temperatures (700°C to 1300°C) and lower pressures. Carbon-containing gas is pumped into a vacuum chamber, depositing onto a diamond seed and crystallizing as synthetic diamond. The eventual size of the diamond depends on the time allowed for growth. The growth process typically takes 4-6 weeks.
Most of the HPHT rough used for jewellery manufacturing is imported from China. CVD equipment cost is lower than HPHT equipment. India exports mainly CVD diamonds and diamond studded diamond-set jewellery using both HPHT and CVD diamonds.
LGD Technology landscape:
WD Lab Grown Diamonds (alias M7D Corporation) is the exclusive licensee of a portfolio of patents covering single crystal CVD diamond growth technology developed by The Carnegie Institution of Washington.
- Patent No. 6,858,078 (February 2005) – covers CVD diamond growth using microwave-plasma
- Carnegie patent RE41,189 (April 2010) – reflects a high-pressure, high-temperature annealing process that improves a diamond’s visual qualities
Seki Diamonds (Cornes Tech) is possibly the biggest/advanced manufacturer of microwave plasma CVD systems. LCD reactor typically costs $175,000.
Also, Seki has expertise in diamond seeds which is one critical component for output quality.
Lab grown diamonds: Supplementary or substitute:
Industries tryst with synthetic diamond is not new. In late 80s, industry experimented with Cubic Zirconia and Moissanite. However, those were far behind on physical, chemical properties. A cubic zirconia does not contain carbon, so does not qualify as a diamond. Cubic zirconia is less hard and does not look quite the same to the naked eye, unlike a lab diamond, which has the same look and physical properties as a natural diamond. Diamonds score a perfect 10 on the Mohs scale of hardness, while moissanite is between 9-9.5, and cubic zirconia 8. The refractive index of cubic zirconia is lower than a diamond, 2.2 vs. 2.42. Moissanite actually has a higher refractive index (2.65 – 2.69)
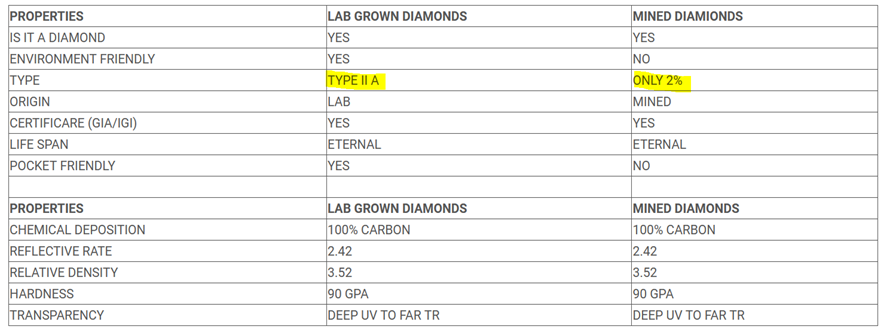
However, Lab Grown Diamonds are ticking most of the boxes both on properties and 4C attributes of diamonds.
Diamond Purity grading:
- IA diamonds contain Nitrogen (N) atoms in clusters. Approximately 95% of natural diamonds are type Ia diamonds.
- IB diamonds contain Nitrogen (N)atoms as isolated atoms instead of clusters.
- IIA diamonds have no measurable Nitrogen (N) or Boron (B) impurities, just pure Carbon (C). Less than 2% of mined diamonds are type IIa diamonds (Kohinoor and Hope Diamond). All lab grown diamonds are type IIa diamonds.
- IIB diamonds have Boron (B) as their trace element.
Key reasons adding shine/legitimacy to Lab Grown Diamonds (specifically the CVD based LGD):
- Most importantly, A CVD produced diamond is mostly Type IIa (2a), considered to be the purest category of diamond. (no nitrogen and/or Boron impurities). Whereas only 2% of the natural diamonds fall into type IIa (2a).
- The Federal Trade Commission (FTC) has amended the guidelines to classify both natural and Lab grown as ‘diamonds. They have decided to drop the word “natural” from the definition of diamonds thereby putting both LGD and earth extracted diamonds at same footing.
- Premium industry body like GIA are employing the same terminology to grade lab grown diamonds.
- Industrial diamond initself is a BIG enough category. According to the US Geological Survey, 90% of diamonds used in US industries come from labs. Simultaneously, most geological diamonds used in industrial processes come as a by-product of producing mining gems for jewellery. The customisability of lab-grown diamonds makes them ideal for the needs of industry.
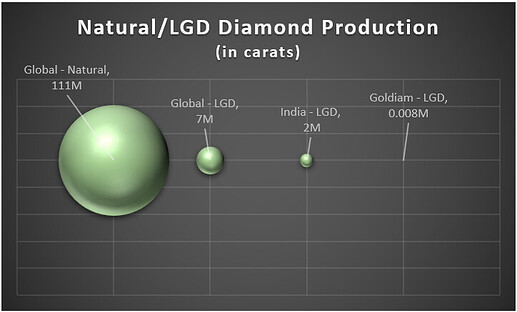
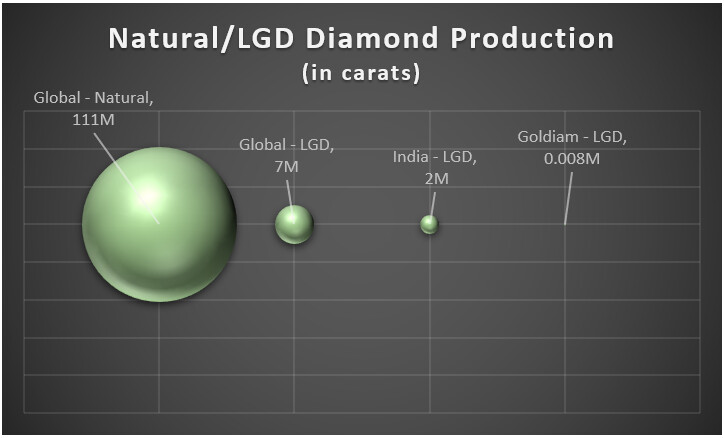
Market size in USD/carats and Growth projections:
-
In Carat Terms: Seven million carats of lab-grown diamonds were produced in 2020 worldwide. Out of that, 1.5 million carats were made in India. Approx 7800 carats by Goldiam. All these numbers seem tiny compared to the 111 million carats of Natural diamonds.
-
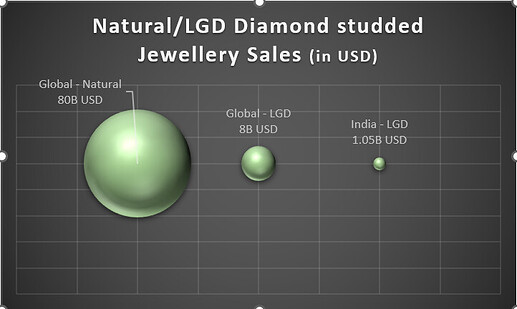
In value (USD) terms: Global lab-grown diamond jewellery sales could top $8 billion in 2022 and near the $10 billion mark by 2023. In contrast, polished natural diamond is pegged at $27B and polished diamond jeweller segment is pegged at ~$80B.

India LGD key players: size and scale:
Industry sources estimate that there are currently < 20 growers in India with a combined capacity of 3,000 CVD reactors with each reactor carrying a capacity of churning out 175 carats per month, which is minuscule compared to the demand. As expected, Indian CVD manufacturing is concentrated to Surat, Jaipur and few in Mumbai.
According to the Gem & Jewellery Export Promotion Council, India exported $1.05 billion worth of polished lab-grown diamonds from April 2021 to January 2022, registering growth of nearly 113 percent. Further, polished lab-grown diamonds witnessed a growth of 105.58 per cent to Rs 2,499.95 crore ($325.45 million) in April and May 2022, as against Rs 1,216.06 crore ($164.52 million) in April and May 2021.
India based LGD players who has access to WD Lab grown patented technology by way of sub-licencing agreement with WD Lab:
- Ethereal Green Diamonds LLP (“EGDL”) and its affiliate The Diamond Library.
- ALTR (India) Private Limited and ALTR Inc
- Evolution Diamond
- Goldiam is indicating that it has perpetual sub-licencing agreement for the patents (may be reference to WD Lab patent).
Other key players (may be without WD Lab patent agreement) are:
- GreenLab Diamon LLP whose Revenue is estimated to have increased to around Rs 229 crores in fiscal 2022, from Rs 65 crores in fiscal 2021 and Rs 20.6 crores in fiscal 2020
- Bhanderi LabGrown
- Cupid Diamonds
Trade channels across the globe are embracing LGD with serious effort and investment:
-
Signet Jewellers, the world’s largest retailer of diamond jewellery with more than 2900 stores in the U.S. alone (plus another 650+ in Canada and the U.K.) under well-known names such as Kay Jewellers, Jared and Zales. They have 6% market share in US jewellery and watch market. Signet so far has been selling Lightbox LGD collection from De Beer’s. They piloted the program with e-commerce business, James Allen. Have expanded market reach by selling loose lab-grown diamonds at its upper-mid-market Jared and Kay brands.
Signet CEO Gina Drosos had previously indicated the company’s appetite for a move into the
lab-grown market. During a conference call with analysts last year, she said the company would ensure it was “well positioned to participate in that space”. -
Based on Tenoris data, less than 19% of US independent jewellers sold lab-grown diamonds in January 2020. Currently, about 50% of specialty retailers sell jewellery set with these stones
-
De Beers subsidiary company Lightbox Jewellery exclusively sells synthetic stones made by another De Beers company, Element Six. Element Six is investing $94m in a new synthetic diamond manufacturing line in Oregon, US. De Beers seriousness for LGD can be gauged by its predatory pricing (dated article)
-
In May 2021, jewellery company Pandora announced it would use only synthetic diamonds.
-
LUSIX, a leading producer of lab-grown diamonds (LGD), announced that high-profile investors, including LVMH Luxury Ventures, Ragnar Crossover Fund and More Investments, have completed an investment round of $90 million. The new facility will enable LUSIX to better serve the increasing demand for LGD, from its clients worldwide and from the overall industry.
-
Just a year back, a trade show organized by Lab-Grown Diamond and Jewellery Promotion Council (LGDJPC) in India generated business of Rs. 5000 Crores within 4 days of exhibition.
Goldiam Edge:
-
SCS 007 certification: The SCS-007 Standard, developed under an international multi-stakeholder process, establishes a uniform basis for independently assessing and certifying the environmentally and socially responsible production and handling of all diamonds, whether mined or laboratory grown. Key Jewellery retailer like Signet/De Beers has a comprehensive responsive sourcing protocol covering aspects like ‘no blood diamond’ and environment neutrality. So far, following four LGD players have got the SCS 007 certification: Green Rocks, Goldiam USA, Lusix, and WD Lab Grown. Also, two retailers have initiated the certification process: Helzberg Diamonds and Swarovski. Interestingly Goldiam is a longstanding supplier to Helzberg.
-
Vertically integrated: Goldiam is perhaps only listed player covering entire value chain. They grow, cut, polish diamonds, design and manufacture jewellery in-house that is distributed through their U.S. office. Vertical integration adds ~20 percent to our bottom line.
-
Deep connect within LGD eco-system and retail distribution channels. During one of the past concalls, Goldiam management had indicated about getting empanelled with world’s largest Jewellery retailer (was that referencing to Signet??). This is beyond the current 5 large retailers that Golidam is working with. Management feels that each of them are big enough to procure LGDs between USD 5M to USD 50M.
-
Capex Glide path: Management has been indicating about taking LGD segment to ~50% of revenue in next 3-5 years. Towards that, capex announced of Rs 100M which will extend the existing capacity by 35% – 40%. As per management commentary, this entire expanded capacity is based on confirmed order commitments. Additionally, management is guiding for an additional INR 300M – 400M capex within 1 year to double the existing LGD capacity.
-
Guidance for ~40% standalone profit distribution by way of buy-back and dividends. Have been walking the talk so far. As a result, promoter shareholding has increased marginally over period of time.
Key Negatives:
-
Legacy Income Tax issue (most of the info is available in public domain).
-
Eco-friendly LLP is the primary vehicle for them to carry on the Lab Grown Diamond cultivation business. Looking at the related party transaction, looks like value-add work is happening between Goldiam Intl to Golidam USA. However, for that to be true, there must be some entries to record purchase of LGD from Eco-friendly to Golidam Intl. There is no purchase from Eco-Friendly LLP under related party transactions. Only related party transaction with Eco-Friendly LLP is by way of rent receipt of ~6Lac per annum. Therefore, little unclarity on the flow of good and material from accounting perspective.
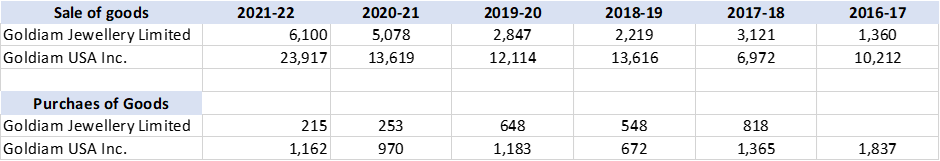
Another possibility, transactions are happening directly between Eco-friendly and Goldiam USA
circumventing standalone Goldiam intl books. This looks little unlikely as share of profit from
Eco-Friendly Diamond LLP is just 5.91 Crs only. (under other income). -
First trench of 50% shares of Eco-Friendly LLP were acquired in Q3’FY21 however, investor presentation represents this during 2015-18. Why this misrepresentation?
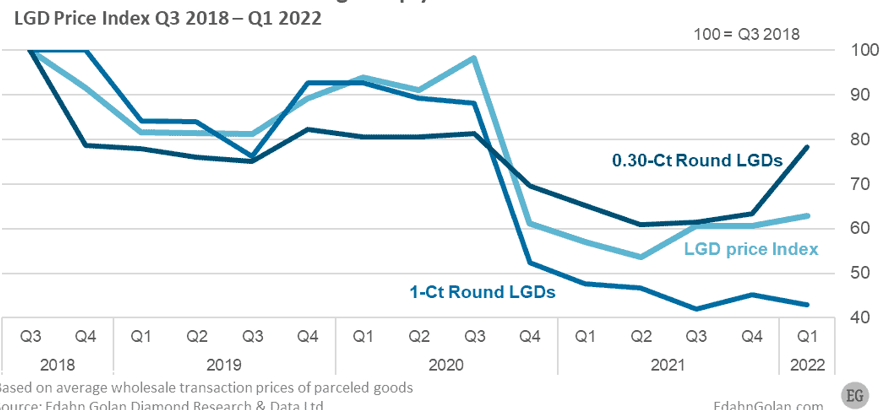
-
Loss of value: One of the study suggests that LGD price has come down to 60 points when indexed to Q3’18 price. In fact 1 Carat plus segment is worst hit where prices has crashed to 40 index points. Goldiam is predominantly into 1+ carat size LGD. This price erosion is expected to further accelerate with tech improvement and competition heating up. Will the LGD industry be able to offset the price erosion by expanding market further. Even then, what is the impact on margins?

Concluding Thought:
Lab grown Diamonds space is looking fascinating. Keeping perception and emotional aspects aside, LGD are turning out to be technically very close to real natural diamonds. As one of the key investment considerations, total addressable market is HUGE – covering complimentary fashion category first and eventually eating into bigger Natural diamonds territory as substitute play. Goldiam on its part can do great considering the early mover advantage and capturing full value chain by way of vertical integration. On the flip slide, considering the sharp price deteriorating cliff, it will take a lot of market expansion, volume growth just to maintain top line numbers.
Disc: No investment.
Some of the data points may be bit dated since did this self-documentation ~1 Year+ back.
Thanks,
Tarun