But Don’t invest only for high dividend yield:

However, investors have to be wary of the companies on the list and should not invest only for dividend yield. Some of the companies have serious corporate governance issues and the entire capital invested in them may be at risk.
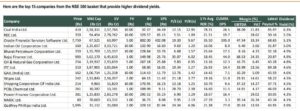
Zylog is a good example of this. Though it presently offers a high dividend yield of 9.6% and trades at a low PE of 0.4, this is because its share price crashed owing to some serious sell-off of the pledged shares of the promoters of Zylog.
The other problem is with stocks like Sree Shakti Paper Products which has an excellent dividend yield of 8.3%. However, the liquidity of the stock is low and so if you do end up with a large quantity of shares, finding a buyer may be difficullt.
So, before investing, investors should also take a good and hard look as to why the dividend yield is so high before committing their funds.
|
Sr No |
Company |
Dividend (%) Latest |
Dividend (%) Latest1 |
Equity Rs Cr |
EPS Rs |
52 Week High Rs |
52 Week Low Rs |
Mkt Cap |
CMP |
FV |
BSE-Qrtly Avg Vol (In’000) |
BV |
D/E Ratio |
Dividend Yield % |
PE |
|
1 |
Zylog Systems |
100 |
80 |
16.5 |
124.3 |
340.0 |
51.7 |
172.1 |
52.3 |
5 |
308.0 |
276.3 |
0.8 |
9.6% |
0.4 |
|
2 |
Sr.Sakthi Paper |
21 |
21 |
16.4 |
4.0 |
30.8 |
22.0 |
41.7 |
25.4 |
10 |
10.0 |
25.6 |
1.0 |
8.3% |
6.3 |
|
3 |
HCL Infosystems |
150 |
400 |
44.6 |
3.2 |
51.8 |
34.9 |
867.1 |
38.9 |
2 |
150.5 |
85.7 |
0.3 |
7.7% |
12.0 |
|
4 |
S Kumars Nation |
10 |
10 |
297.4 |
13.7 |
40.0 |
12.6 |
400.9 |
13.5 |
10 |
1232.4 |
99.5 |
1.1 |
7.4% |
1.0 |
|
5 |
SRF |
140 |
140 |
57.4 |
64.1 |
304.5 |
192.2 |
1149.8 |
200.3 |
10 |
10.3 |
304.6 |
0.7 |
7.0% |
3.1 |
|
6 |
Infinite Comp |
85 |
0 |
42.6 |
28.1 |
166.9 |
69.0 |
529.7 |
124.5 |
10 |
27.2 |
119.6 |
0.1 |
6.8% |
4.4 |
|
7 |
Sicagen India |
10 |
10 |
39.6 |
5.2 |
22.8 |
14.1 |
59.9 |
15.2 |
10 |
7.7 |
111.5 |
0.2 |
6.6% |
2.9 |
|
8 |
Hinduja Global |
200 |
200 |
20.6 |
51.5 |
364.0 |
280.0 |
626.1 |
304.1 |
10 |
0.7 |
557.7 |
0.4 |
6.6% |
5.9 |
|
9 |
IL&FS Inv Manage |
75 |
75 |
41.8 |
3.6 |
32.0 |
23.0 |
484.4 |
23.2 |
2 |
52.0 |
11.2 |
0.4 |
6.5% |
6.5 |
|
10 |
Cosmo Films |
50 |
50 |
19.4 |
16.2 |
104.0 |
75.1 |
150.9 |
77.6 |
10 |
5.4 |
172.2 |
1.3 |
6.4% |
4.8 |
|
11 |
JBF Inds. |
80 |
80 |
72.3 |
30.9 |
151.7 |
97.9 |
906.4 |
125.4 |
10 |
45.0 |
222.1 |
1.5 |
6.4% |
4.1 |
|
12 |
XPRO India |
25 |
20 |
11.7 |
29.6 |
63.5 |
39.3 |
47.6 |
40.9 |
10 |
3.3 |
126.8 |
0.4 |
6.1% |
1.4 |
|
13 |
Ludlow Jute |
20 |
25 |
10.8 |
4.6 |
42.5 |
26.2 |
36.0 |
33.4 |
10 |
5.6 |
33.4 |
0.2 |
6.0% |
7.3 |
|
14 |
Thinksoft Global |
50 |
10 |
10.1 |
11.3 |
123.4 |
40.0 |
84.8 |
84.4 |
10 |
64.8 |
75.1 |
0.0 |
5.9% |
7.5 |
|
15 |
Ucal Fuel Sys. |
40 |
40 |
22.1 |
10.8 |
84.9 |
63.0 |
150.0 |
67.9 |
10 |
9.5 |
28.1 |
6.4 |
5.9% |
6.3 |
|
16 |
Sasken Comm.Tec. |
70 |
70 |
24.1 |
24.8 |
151.9 |
103.0 |
288.4 |
119.7 |
10 |
22.4 |
184.4 |
0.0 |
5.9% |
4.8 |
|
17 |
NIIT |
80 |
75 |
33.0 |
6.7 |
56.3 |
26.1 |
459.8 |
27.9 |
2 |
183.7 |
40.1 |
0.4 |
5.7% |
4.2 |
|
18 |
Manugraph India |
125 |
75 |
6.1 |
7.6 |
58.7 |
44.6 |
135.9 |
44.7 |
2 |
4.2 |
65.7 |
0.1 |
5.6% |
5.9 |
|
19 |
NRB Bearings |
100 |
100 |
19.4 |
5.2 |
49.5 |
34.0 |
349.3 |
36.1 |
2 |
7.5 |
24.1 |
0.8 |
5.5% |
7.0 |
|
20 |
Goldiam Intl. |
15 |
10 |
25.0 |
6.1 |
34.4 |
20.8 |
67.7 |
27.2 |
10 |
3.8 |
83.8 |
0.3 |
5.5% |
4.4 |
|
21 |
GHCL |
20 |
20 |
100.0 |
4.7 |
44.2 |
28.0 |
372.1 |
37.2 |
10 |
54.1 |
48.2 |
3.6 |
5.4% |
8.0 |
|
22 |
K G Denim |
7.5 |
0 |
25.7 |
2.9 |
17.0 |
8.0 |
36.0 |
14.0 |
10 |
50.6 |
17.7 |
2.2 |
5.3% |
4.8 |
|
23 |
TVS Srichakra |
135 |
125 |
7.7 |
51.2 |
380.0 |
242.0 |
196.5 |
256.5 |
10 |
0.9 |
184.2 |
2.5 |
5.3% |
5.0 |
|
24 |
Lahoti Overseas |
20 |
0 |
5.8 |
2.4 |
9.3 |
5.5 |
22.6 |
7.8 |
2 |
10.7 |
21.5 |
0.3 |
5.2% |
3.3 |
|
25 |
Sona Koyo Steer. |
65 |
65 |
19.9 |
2.5 |
15.2 |
9.0 |
250.8 |
12.6 |
1 |
59.2 |
12.0 |
1.3 |
5.2% |
5.2 |
|
26 |
Energy Devl.Co. |
12 |
0 |
27.5 |
2.6 |
52.0 |
22.1 |
64.2 |
23.4 |
10 |
8.0 |
47.2 |
1.2 |
5.1% |
8.9 |
|
27 |
Bombay Burmah |
70 |
70 |
14.0 |
165.1 |
158.6 |
77.8 |
193.1 |
138.5 |
10 |
83.1 |
156.5 |
1.1 |
5.1% |
0.8 |
|
28 |
Goa Carbon |
40 |
40 |
9.2 |
11.4 |
116.4 |
67.5 |
72.6 |
79.3 |
10 |
26.9 |
86.3 |
2.2 |
5.0% |
6.9 |
|
29 |
Shree Gan.Jew. |
60 |
60 |
60.7 |
76.0 |
139.5 |
65.2 |
727.9 |
120.0 |
10 |
117.8 |
258.6 |
0.6 |
5.0% |
1.6 |
|
30 |
Rane Holdings |
100 |
125 |
14.3 |
50.2 |
232.9 |
186.5 |
289.6 |
202.8 |
10 |
0.9 |
299.4 |
0.6 |
4.9% |
4.0 |
|
31 |
ABG Infra |
50 |
50 |
12.0 |
-3.9 |
244.0 |
98.4 |
122.1 |
102.0 |
10 |
4.2 |
297.2 |
1.1 |
4.9% |
-26.0 |
|
32 |
India Nipp.Elec. |
90 |
95 |
11.3 |
27.4 |
199.0 |
156.8 |
211.7 |
187.2 |
10 |
1.0 |
161.3 |
0.0 |
4.8% |
6.8 |
|
33 |
Rolta India |
30 |
35 |
161.3 |
15.0 |
108.1 |
58.9 |
1022.8 |
63.4 |
10 |
186.9 |
125.1 |
0.8 |
4.7% |
4.2 |
|
34 |
Dai-ichi Karkari |
20 |
20 |
7.5 |
5.7 |
48.7 |
34.6 |
31.7 |
42.5 |
10 |
4.2 |
88.7 |
0.0 |
4.7% |
7.5 |
|
35 |
Aptech |
30 |
25 |
48.8 |
15.6 |
98.6 |
64.0 |
318.4 |
65.3 |
10 |
234.4 |
68.1 |
0.0 |
4.6% |
4.2 |
|
36 |
Austin Engg Co |
25 |
25 |
3.5 |
19.0 |
76.9 |
53.5 |
19.1 |
55.0 |
10 |
1.9 |
146.7 |
0.2 |
4.5% |
2.9 |
|
37 |
Andhra Bank |
55 |
55 |
559.6 |
23.9 |
138.5 |
89.7 |
6784.9 |
121.3 |
10 |
137.1 |
134.0 |
0.0 |
4.5% |
5.1 |
|
38 |
Hexaware Tech. |
200 |
150 |
59.3 |
9.1 |
142.0 |
78.0 |
2613.8 |
88.2 |
2 |
474.3 |
34.3 |
0.0 |
4.5% |
9.7 |
|
39 |
MphasiS |
170 |
65 |
210.1 |
37.7 |
439.0 |
317.0 |
7893.8 |
375.7 |
10 |
14.2 |
209.6 |
0.1 |
4.5% |
10.0 |
|
40 |
L G Balakrishnan |
110 |
100 |
7.9 |
56.4 |
361.0 |
240.0 |
194.0 |
247.1 |
10 |
0.8 |
293.0 |
0.6 |
4.5% |
4.4 |
|
41 |
Deepak Fert. |
55 |
50 |
88.2 |
24.0 |
170.0 |
123.0 |
1093.2 |
124.0 |
10 |
12.9 |
136.5 |
0.8 |
4.4% |
5.2 |
|
42 |
Corporation Bank |
205 |
200 |
148.1 |
102.5 |
528.5 |
362.1 |
6860.6 |
463.2 |
10 |
18.2 |
563.4 |
0.0 |
4.4% |
4.5 |
|
43 |
Banco Products |
125 |
150 |
14.3 |
10.7 |
76.4 |
56.0 |
407.2 |
57.0 |
2 |
3.3 |
59.2 |
0.4 |
4.4% |
5.3 |
|
44 |
Kavveri Telecom |
40 |
15 |
20.1 |
26.9 |
271.0 |
76.7 |
183.7 |
91.3 |
10 |
11.5 |
151.9 |
0.6 |
4.4% |
3.4 |
|
45 |
Gateway Distr. |
60 |
60 |
108.4 |
12.2 |
159.9 |
126.0 |
1492.3 |
137.7 |
10 |
22.4 |
69.0 |
0.1 |
4.4% |
11.3 |
|
46 |
Noida Tollbridg. |
10 |
5 |
186.2 |
2.5 |
29.9 |
21.0 |
428.3 |
23.0 |
10 |
65.2 |
25.2 |
0.3 |
4.3% |
9.4 |
|
47 |
Graphite India |
175 |
175 |
39.1 |
10.9 |
99.9 |
74.0 |
1573.9 |
80.6 |
2 |
19.1 |
84.7 |
0.3 |
4.3% |
7.4 |
|
48 |
Standard Inds. |
15 |
15 |
32.2 |
0.1 |
24.3 |
14.2 |
112.9 |
17.6 |
5 |
13.7 |
20.5 |
0.1 |
4.3% |
144.7 |
1. EPS (FY12), BV and D/E are consolidated wherever applicable. P/E is based on FY12 EPS (consolidated, wherever applicable).
2. Unforeseen deterioration in performance could affect dividend payouts and consequently the dividend yields.
3. Companies which have declared Special/extraordinary dividends in FY12/FY11 have been excluded
Best Dividend Paying Stocks For 2013
[download id=”342″]


good